
Cloudflare Workers Observability: Safer Deployments
Cloudflare released two useful Workers observability improvements on 25 September 2026. Metrics charts can now place direct releases, every stage of a gradual deployment and rollbacks directly over error, latency, CPU and memory trends. On the same day, Workers custom tracing gained richer controls for finding the active span, timing a specific operation, recording exceptions and attaching several diagnostic attributes at once.
For an Australian business, the value is not a prettier engineering dashboard. It is a clearer answer to a costly question: did the release cause the problem? When a form stops submitting, checkout slows down, an API integration times out or an automation produces duplicates, release-aware evidence can shorten the path from customer report to diagnosis and safe rollback.
This guide explains how to turn those platform features into a practical operating process. The objective is not to collect every possible log. It is to define the journeys that matter, test them before production, release in controlled stages, watch a small set of useful signals and know who has authority to pause or reverse the change.
Why Cloudflare Workers observability is trending now
The timing comes from several connected releases rather than a single feature. Cloudflare's 25 September Metrics update links operational changes to system behaviour. The expanded custom-span API makes application-specific steps easier to identify inside a trace. Worker Previews, documented for current branch workflows in late September, give each branch a production-like URL and its own observability before the change reaches customers.
There is also an immediate cost decision. Cloudflare says Workers tracing becomes billable from 1 October 2026. Tracing uses observability events and defaults to a 100% head-sampling rate when it is enabled unless a lower rate is configured. Teams experimenting during the beta period should therefore review sampling, retention and ownership before treating the current settings as permanent.
Together, these changes make late September a sensible time to build a release baseline: what runs on Workers, which customer and staff journeys depend on it, what success looks like, what evidence is retained and which threshold triggers a rollback.
Metrics show what changed; logs and traces explain why
A useful monitoring design gives each signal a specific job instead of collecting data without a decision attached.
Metrics
Watch rates and trends such as requests, errors, latency, CPU time and memory, now aligned with releases and rollout stages.
Logs
Capture searchable business and technical events, warnings and exceptions with enough context to investigate without exposing unnecessary personal data.
Traces
Follow a request across Worker handlers, outbound services, storage bindings, RPC calls and custom business operations to locate the failing step.
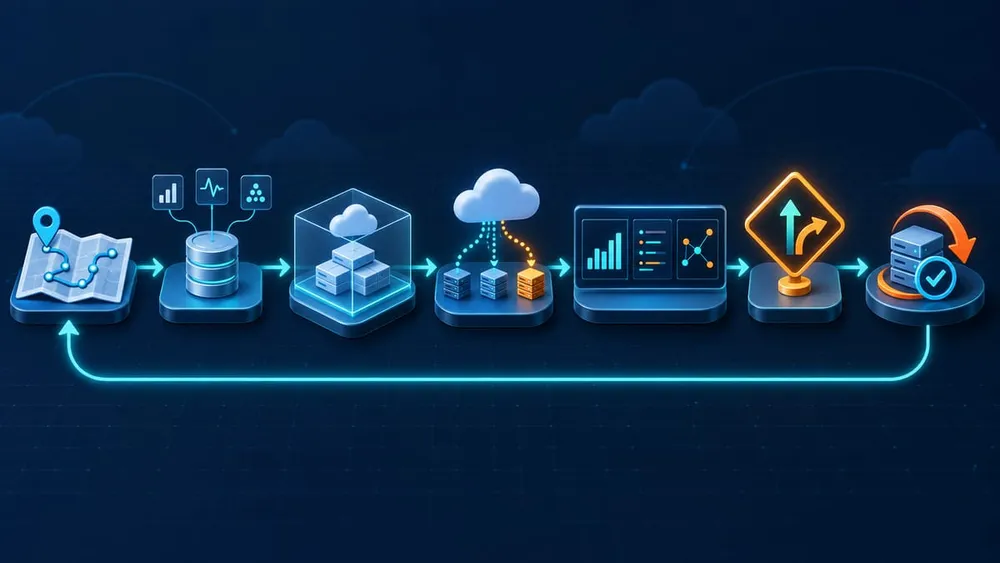
Move from isolated preview to evidence-based rollback
Start with the business journey, not the dashboard
A Worker may sit in front of a website, transform an API response, validate a booking, issue an authentication token, process a queue, route traffic or coordinate an AI workflow. Its technical name rarely describes the full business consequence of failure.
Create a small service map for each important journey. Record the public route or trigger, the Worker and version, downstream APIs, data stores, queues, payment or CRM dependencies, expected result, business owner and technical owner. For a lead form, for example, success might mean more than an HTTP 200 response: the submission should be stored, the CRM record should exist once, the confirmation should be sent and the customer should see a useful outcome.
This map determines what to test and monitor. It also exposes takeover risk. If nobody knows where the Worker is deployed, which repository builds it or who can roll it back, observability alone will not make the service supportable.
Use Worker Previews before production
Worker Previews provide an isolated, production-like environment for a branch, with its own URL, variables, secrets, bindings and observability. That makes them useful for testing real redirects, authentication callbacks, browser behaviour and third-party integrations before merging a release.
The word isolated still needs careful reading. Cloudflare automatically separates some resources, including Durable Objects and Containers, for each Preview. Other account-level resources such as KV, D1 or R2 can be shared if the same binding is used. A test that writes to a shared resource can therefore change production-like data or produce a misleading pass. Configure separate test resources where the workflow writes state, sends notifications or calls an external system.
Run complete journeys against the Preview, not only unit tests. Include the normal path, a validation failure, a downstream timeout, a retry and a duplicate event. Capture the expected technical signal and business outcome for each scenario so the same evidence can be checked during production rollout.
Release gradually and watch the change itself
Gradual deployments split production traffic between the previous and new Worker versions. Instead of moving every request at once, the team can start with a small percentage, observe the result and increase traffic only when agreed thresholds remain healthy.
The new Metrics annotations reduce a familiar diagnostic gap. A rollout appears as a shaded progression, so the team can compare errors, latency, CPU time or wall time as more traffic reaches the new version. Direct releases appear as markers, and a rollback appears as its own event. That makes it easier to see whether a regression begins at a particular rollout stage and whether the rollback actually restores the baseline.
Do not treat traffic percentage as the only control. Check whether the sample includes representative customer journeys, regions and authenticated states. Where one Worker calls another through a service binding, Cloudflare warns that independently progressing deployments can create version skew. Test compatible contracts or pin downstream versions where a mixed old/new combination could fail.
Add traces around business-critical operations
Workers tracing automatically covers handler calls, outbound fetches, bindings and RPC calls after tracing is enabled. Custom spans add the business context that infrastructure spans cannot infer. Useful span names might represent operations such as validate-booking, create-crm-lead, calculate-delivery-rate or reserve-inventory.
The expanded API can retrieve the active span from helper code, create a manual span, record an exception and attach several attributes. Use those attributes to answer diagnostic questions such as which integration, workflow version or outcome was involved. Avoid copying form bodies, access tokens, free-text messages or full customer records into telemetry. Prefer low-cardinality identifiers and outcome categories, and govern retention as you would any other operational data.
Logs written inside an active custom span are correlated with that span. That can connect a concise structured event to the wider request path without forcing an operator to match timestamps manually.
Define release gates before the rollout
A release gate is a decision rule, not a graph someone promises to watch. Agree the baseline, observation window, owner and response before production traffic moves.
| Signal | Example gate | Business check |
|---|---|---|
| Error rate | No statistically meaningful increase from the recent baseline | Forms, checkout or staff actions still complete successfully |
| Latency | Critical route remains within its agreed response target | Customers are not abandoning the journey |
| Exceptions | No new exception type or repeated failure in the new version | Support has no matching incident pattern |
| Downstream calls | Timeout and retry rates remain within normal range | CRM, payment, booking or fulfilment records reconcile |
| Resource use | CPU and memory remain stable as traffic rises | The release can scale without avoidable cost or throttling |
Use the same gates at each rollout stage. A short low-traffic pass does not prove safety for a monthly invoice run or peak campaign, so schedule follow-up checks around the workflows that occur less frequently.
Avoid the signals that create false confidence
Good observability is selective, testable and tied to an operational response.
Only watching HTTP errors
A request can return 200 while failing to create the CRM, order, booking or notification outcome the business needs.
Logging everything
Unlimited detail raises cost, privacy and search-noise risks. Capture the minimum context needed to diagnose and reconcile.
No version in the evidence
Without release and version context, a regression can be confused with traffic, dependency or data changes.
No named responder
A useful alert still fails operationally when nobody owns the first investigation, customer impact decision or rollback.
Plan sampling, retention and cost before 1 October
Cloudflare documents a default trace sampling rate of 1 when tracing is enabled, meaning every incoming request is selected unless the configuration sets a lower head_sampling_rate. Logs and traces can use separate rates. High-volume Workers should choose sampling deliberately, then confirm that rare but important failures remain observable.
Cloudflare says tracing becomes billable from 1 October 2026. Its current documentation lists short native retention windows: three days for the Free plan and seven days for Paid observability data. Those windows may be enough for rapid incident response but not for monthly reconciliation, audit evidence or trend analysis.
OpenTelemetry export can send traces and logs to an existing observability destination, with an option not to persist them in Cloudflare. Cloudflare currently notes that Workers infrastructure and custom metrics are not exported through this route. Before adding another platform, define the retention need, data location, access controls, alert ownership and total event volume. More telemetry is not automatically better support.
Make rollback a verified business action
A rollback is complete only when the customer journey and connected records recover. The release marker can show when traffic returned to the previous version and the Metrics chart can show whether technical signals recovered. The team must still verify the business outcome.
For a payment or booking workflow, check for partial records, repeated retries, duplicate notifications and transactions that need reconciliation. For a content or CRM integration, compare source and destination counts and identify messages that remained in a queue. A code rollback does not automatically undo data written by the failed version.
Document the authority to pause a rollout, the command or dashboard path used to reverse it, the communication channel, and the post-rollback reconciliation owner. Rehearse the procedure on a low-risk change. The worst time to discover that only one unavailable contractor can restore the previous version is during an outage.
Build a minimum viable release-observability practice
Start with one revenue-critical or operationally important Worker, prove the loop and then extend it.
Week 1: inventory and ownership
List Workers, repositories, routes, integrations, data stores, deployment access, business owners and rollback owners.
Week 2: baseline and instrumentation
Enable appropriate logs and traces, add a small number of structured events and custom spans, and record normal performance.
Week 3: Preview and release tests
Isolate test resources, run representative journeys, choose staged rollout percentages and agree stop thresholds.
Week 4: supervised production release
Deploy gradually, watch release-aware metrics, investigate traces, reconcile business outcomes and capture lessons.
Questions to ask a development or support partner
The answers should describe evidence, ownership and recovery rather than simply naming monitoring tools.
What customer journeys are covered?
Ask for the routes, integrations and business outcomes included in automated tests and production monitoring.
How are releases correlated?
Confirm version identifiers, deployment markers, rollout stages and the evidence used to link a regression to a change.
What is sampled and retained?
Request the trace and log sampling rates, expected event volume, retention period, access controls and data-handling rules.
Who can roll back and reconcile?
Name the responder, approval path, recovery steps and owner for repairing duplicate, missing or partial downstream records.
What Australian SMEs should prioritise
Small and medium businesses do not need a large site-reliability team to improve release safety. They need clear technical ownership and a repeatable, proportionate process. Start with Workers that sit in front of revenue, lead generation, customer accounts, staff operations or regulated data. A marketing redirect Worker and a payment-routing Worker should not receive the same level of instrumentation or approval.
Prioritise four outcomes: know what changed, know whether the important journey still works, retain enough evidence to investigate, and restore service quickly when it does not. Centralised event logging also supports incident investigation, aligning with Australian Signals Directorate guidance on timely collection and analysis.
If the system has grown through several agencies or contractors, begin with an operational takeover: repository access, Cloudflare roles, environment inventory, deployment history, secrets ownership, monitoring destinations and a tested rollback. New dashboards are useful only after the organisation can act on what they show.
Sources Checked
VaniTech checked the following primary and authoritative sources on 27 September 2026:
- Cloudflare release and gradual-deployment annotations
- Cloudflare custom tracing API announcement
- Cloudflare custom spans documentation
- Cloudflare Workers tracing, sampling and pricing
- Cloudflare gradual deployments
- Cloudflare Worker Previews
- Cloudflare Preview resource isolation
- Cloudflare Workers Logs
- Cloudflare OpenTelemetry export
- Cloudflare Workers best practices
- Australian Signals Directorate event-logging guidance